
Abstract
Maps are widely used to visualize spatial data but can be difficult for people with color blindness to interpret. The cblindplot R package offers a simple, automated solution for creating color-blind-friendly maps. With the cblind.plot function, users can input an image, select their type of color blindness, and receive an accessible visualization. This paper introduces the package and its functionality, highlighting its potential to improve accessibility in scientific mapping.
1. Introduction
Maps are essential tools for visualizing geographic and spatial data, used in fields like environmental science and geography. However, traditional color schemes can be inaccessible to people with color blindness, which affects around 8% of men and 0.5% of women. To address this, we introduce the cblindplot R package, which automates the process of creating maps that are easy to interpret for color-blind individuals.
2. Methods
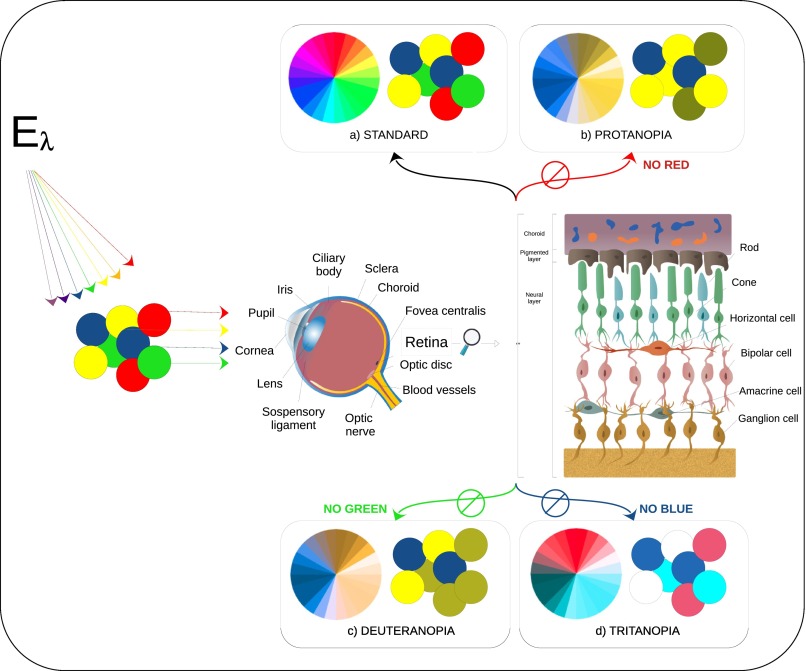
The cblind.plot function allows users to input an image or map and select their type of color blindness—protanopia, deuteranopia, or tritanopia. The function adjusts the color palette accordingly, ensuring the map is accessible. It also integrates with the viridis package for color-blind-friendly palettes and uses Principal Component Analysis (PCA) to optimize the visualization for clarity.
3. Results
The cblindplot package simplifies the process of making maps accessible to color-blind users. Instead of manually adjusting colors, users can automate the process in R with a single function. The package applies scientifically tested color palettes and uses PCA to retain key spatial details while enhancing map readability for color-blind individuals.
4. Conclusion
The cblindplot R package provides an efficient solution for creating accessible maps, ensuring that color-blind individuals can interpret spatial data accurately. By automating the process and applying optimized color palettes, the package improves inclusivity in scientific communication. Its open-source nature makes it easy to integrate into existing workflows, providing a valuable tool for researchers and educators.
See the full text here https://www.sciencedirect.com/science/article/pii/S1574954123000742